
Hayden's Archive
[Python-matplot/pandas] 히스토그램(Histogram) 그리기 / Pandas를 이용한 Plot 시각화 본문
Study/Data
[Python-matplot/pandas] 히스토그램(Histogram) 그리기 / Pandas를 이용한 Plot 시각화
_hayden 2020. 7. 15. 11:10* 히스토그램 Histogram 그리기
count는 전체의 count가 될 수 있음
value_counts()-> x축 각 값마다의 count를 센다.
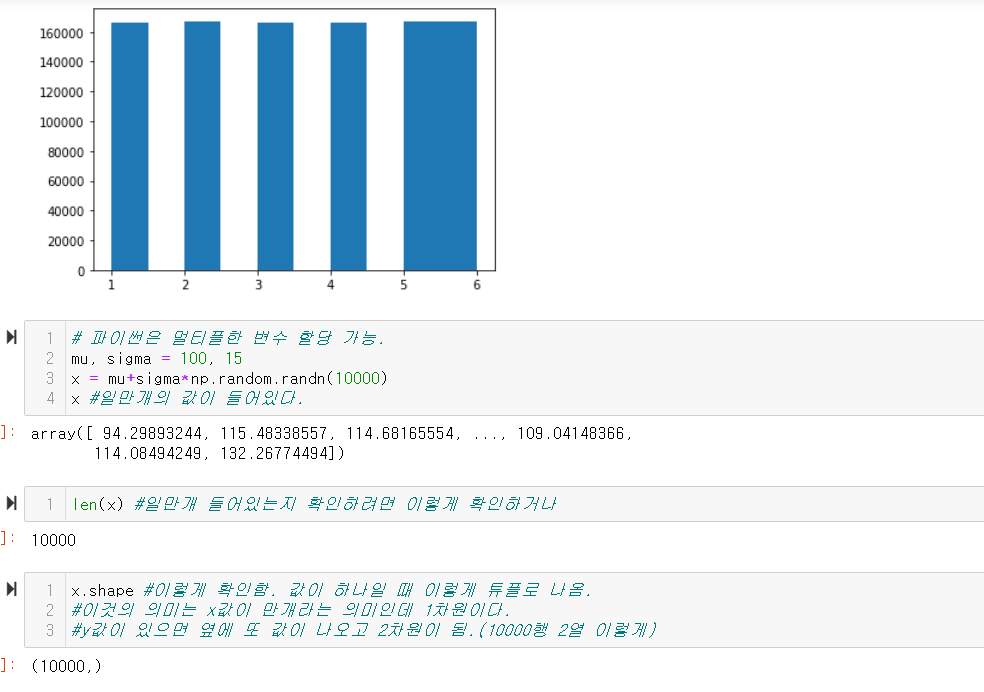
히스토그램은 계급별 도수의 개수


plt.hist? 에서 Returns 보면
n과 bins, patches가 리턴되는 것을 알 수 있음


* 그래프에서 한글 깨지는 현상 방지 코드
import platform

from matplotlib import font_manager, rc
plt.rcParams['axes.unicode_minus'] = False

if platform.system() == 'Darwin':
    rc('font', family='AppleGothic')
elif platform.system() == 'Windows':
    path = "c:/Windows/Fonts/malgun.ttf"
    font_name = font_manager.FontProperties(fname=path).get_name()
    rc('font', family=font_name)
else:
    print('Unknown system!!')

* Pandas를 이용한 Plot 시각화


'Study/Data' Related Articles
more


